Skip to content

Home Services Dashboard Analysis & Creation

Dashboards people actually open every morning

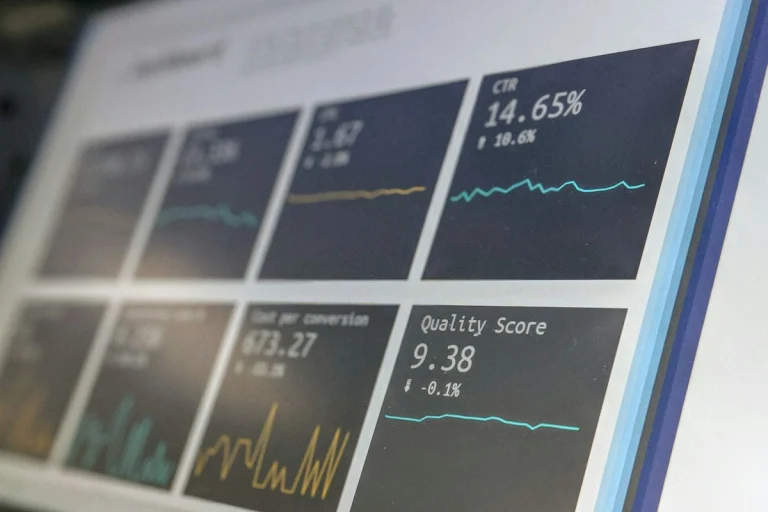
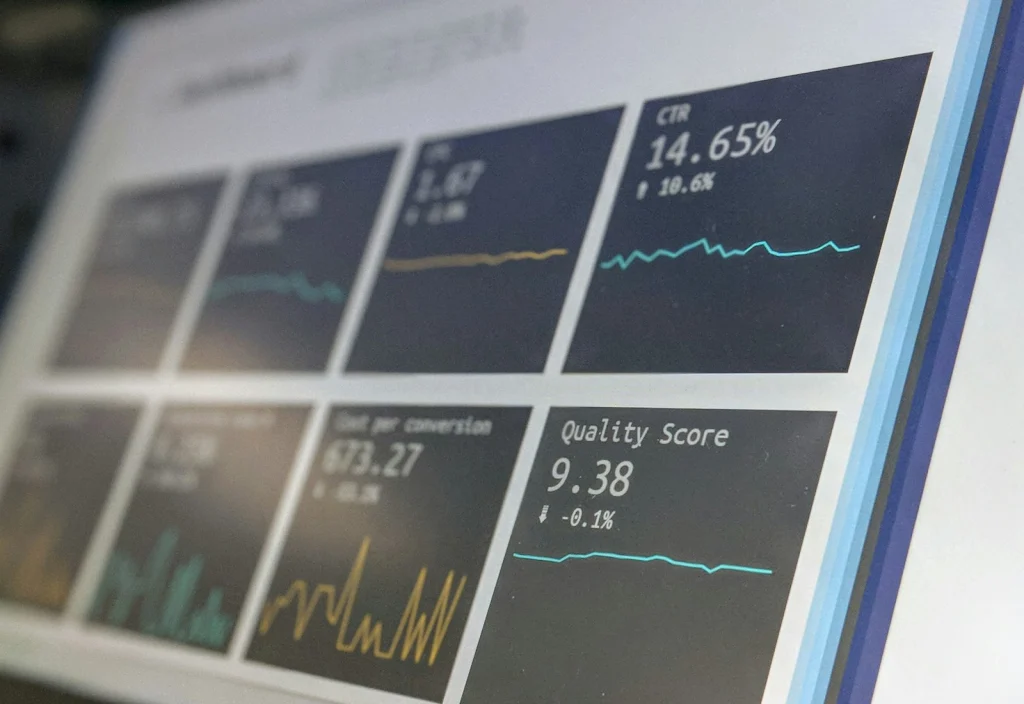
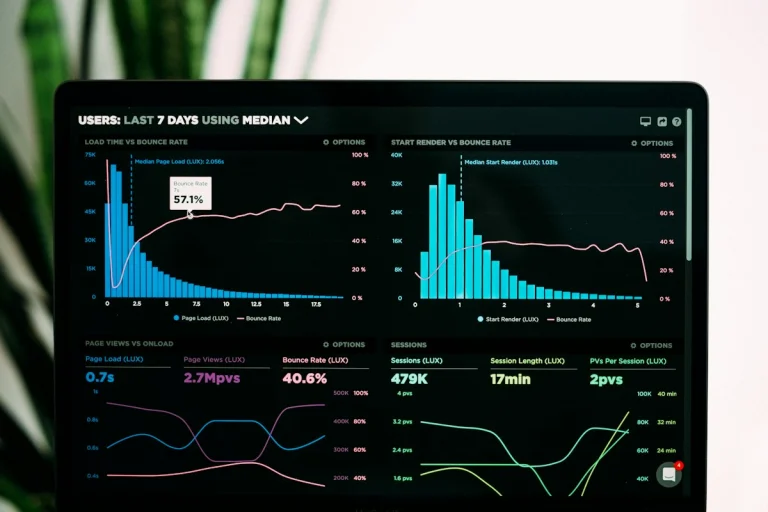
Clear, fast and beautifully designed dashboards for sales, marketing, finance and operations. Built in Power BI, Looker Studio, Tableau or as custom web dashboards.

At a glance

200+dashboards designed and delivered
5sto understand the main KPI
80%faster report loading after optimisation

Overview

A dashboard is only useful if it is understood in five seconds

Most dashboards fail because they show everything. Dozens of charts, no hierarchy and unclear numbers mean people stop opening them after the first week.

We design dashboards like products: the most important KPI first, clear comparisons to targets and history, and drill-downs only where they help a decision.

We also analyse your existing dashboards, fix broken metrics and slow reports, and turn the numbers into written insights your leadership team can act on.

This service works best alongside our Business Intelligence Services and Data Science Services services. For a deeper introduction, read our guide: Power BI vs Tableau vs Looker Studio.

What's included

Project photo
dashboards designed and delivered
0 +
to understand the main KPI
0 s
faster report loading after optimisation
0 %

Features

What you get with our dashboards service

Everything below is delivered by specialists who focus on dashboards every day.

Designed for clarity

Visual hierarchy, consistent colours and plain-language labels.

Real-time data

Live connections to your ads, CRM, store and databases.

Any tool

Power BI, Looker Studio, Tableau or a custom React dashboard.

Marketing dashboards

GA4, Google Ads, Meta Ads and SEO in one view.

Executive views

One-page summaries with targets, trends and alerts.

Insight reporting

Monthly analysis that explains what changed and why.

Our process

Our Dashboards process

A clear, repeatable process with a checkpoint at every stage, so you always know what is happening and why.

1

Discover

Interview users and define the decisions and KPIs.

2

Wireframe

Sketch layouts and agree the story the dashboard tells.

3

Build

Connect data and build interactive visuals.

4

Refine

Test with users, optimise speed and roll out.

Dashboards tools and platforms we use

Power BILooker StudioTableauGoogle SheetsReactChart.jsGA4SupermetricsPower BILooker StudioTableauGoogle SheetsReactChart.jsGA4SupermetricsPower BILooker StudioTableauGoogle SheetsReactChart.jsGA4SupermetricsPower BILooker StudioTableauGoogle SheetsReactChart.jsGA4Supermetrics

Portfolio

Dashboards projects we have delivered

Browse 50 recent dashboards projects. Click any project to see the details.

Showing 12 of 50 projects

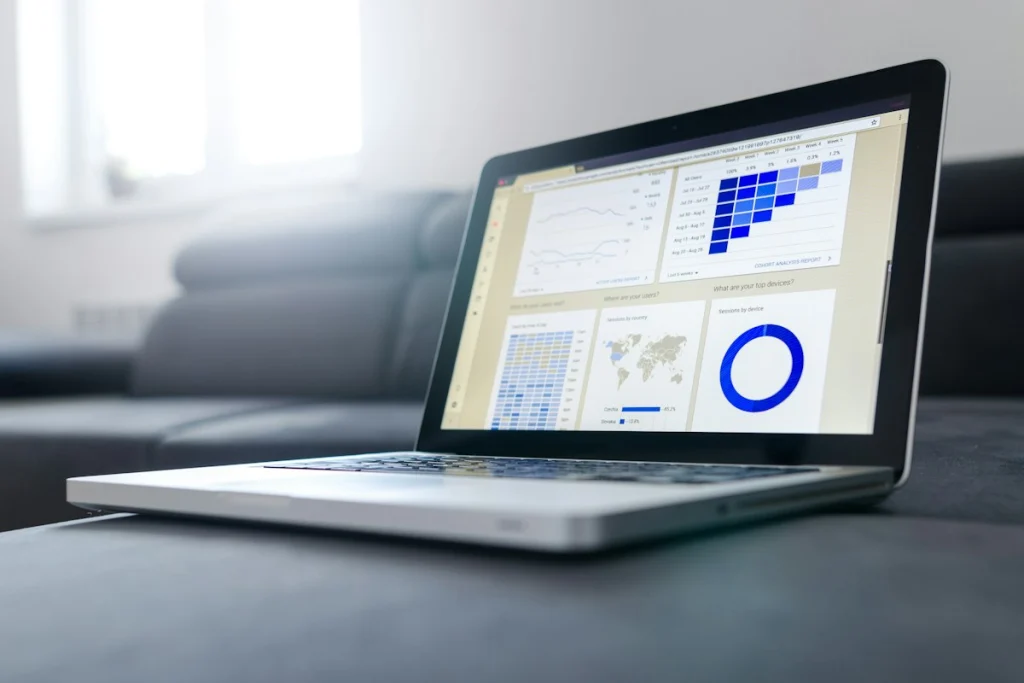
Ecommerce analytics dashboard for a textile exporter in Sydney Dashboards

Manufacturing, Australia · 2025

Ecommerce analytics dashboard for a textile exporter in Sydney

Interactive KPI dashboard designed and built for the leadership team of a textile exporter.

47 KPIs in one view
Client reporting portal for a SaaS startup in Peshawar Dashboards

Technology, Pakistan · 2024

Client reporting portal for a SaaS startup in Peshawar

Interactive KPI dashboard designed and built for the leadership team of a SaaS startup.

Used daily by 139 managers
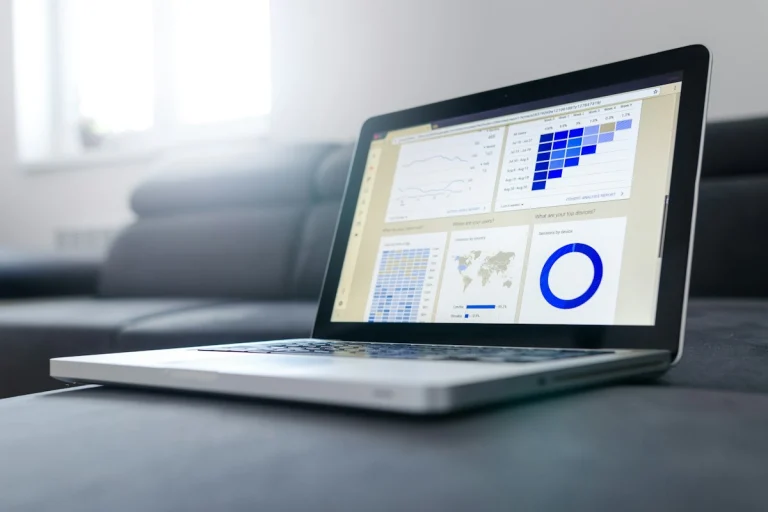
SEO performance dashboard for a skincare brand in Riyadh Dashboards

Beauty, Saudi Arabia · 2024

SEO performance dashboard for a skincare brand in Riyadh

Interactive KPI dashboard designed and built for the leadership team of a skincare brand.

Used daily by 119 managers
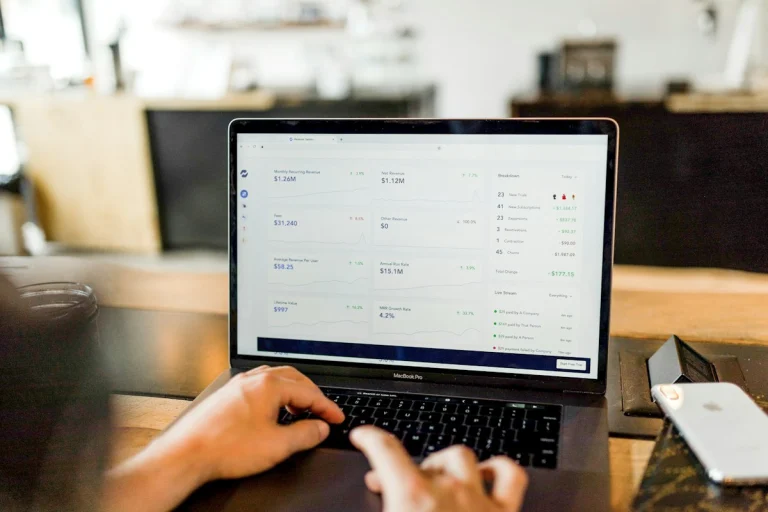
SEO performance dashboard for a fitness studio in Riyadh Dashboards

Health & fitness, Saudi Arabia · 2025

SEO performance dashboard for a fitness studio in Riyadh

Interactive KPI dashboard designed and built for the leadership team of a fitness studio.

Used daily by 107 managers
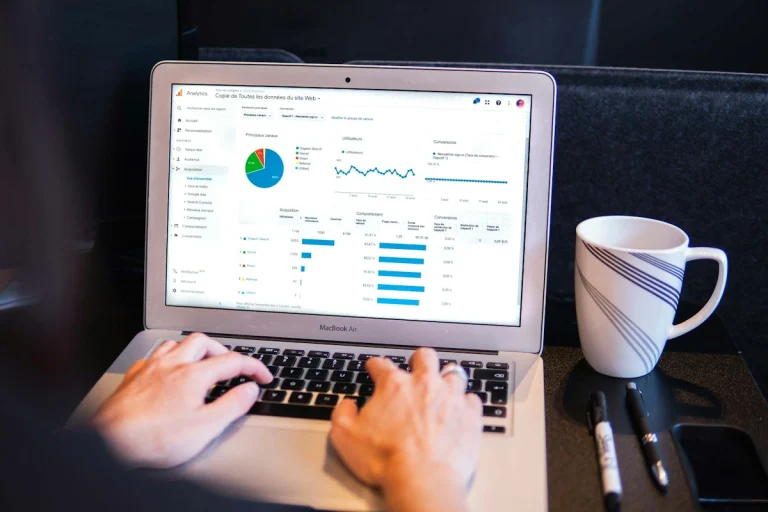
Operations live dashboard for a restaurant group in Faisalabad Dashboards

Hospitality, Pakistan · 2026

Operations live dashboard for a restaurant group in Faisalabad

Interactive KPI dashboard designed and built for the leadership team of a restaurant group.

Used daily by 140 managers
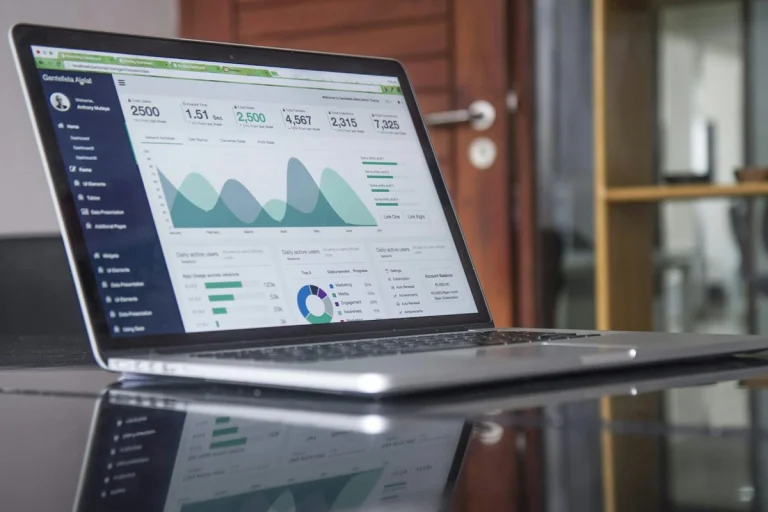
Client reporting portal for a B2B software vendor in Manchester Dashboards

Technology, UK · 2023

Client reporting portal for a B2B software vendor in Manchester

Interactive KPI dashboard designed and built for the leadership team of a B2B software vendor.

Report load time down 59%
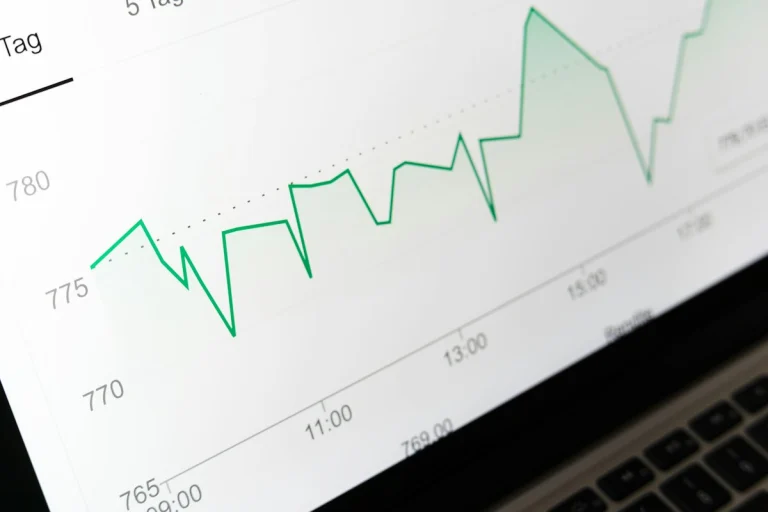
SEO performance dashboard for a grocery delivery app in Peshawar Dashboards

Ecommerce, Pakistan · 2024

SEO performance dashboard for a grocery delivery app in Peshawar

Interactive KPI dashboard designed and built for the leadership team of a grocery delivery app.

66 KPIs in one view

Finance cash flow dashboard for a fashion ecommerce brand in Rawalpindi Dashboards

Ecommerce, Pakistan · 2026

Finance cash flow dashboard for a fashion ecommerce brand in Rawalpindi

Interactive KPI dashboard designed and built for the leadership team of a fashion ecommerce brand.

66 KPIs in one view

SEO performance dashboard for a wedding planner in Riyadh Dashboards

Events, Saudi Arabia · 2023

SEO performance dashboard for a wedding planner in Riyadh

Interactive KPI dashboard designed and built for the leadership team of a wedding planner.

Used daily by 31 managers

Finance cash flow dashboard for a law firm in Toronto Dashboards

Legal, Canada · 2026

Finance cash flow dashboard for a law firm in Toronto

Interactive KPI dashboard designed and built for the leadership team of a law firm.

Used daily by 35 managers

Finance cash flow dashboard for an immigration consultancy in Islamabad Dashboards

Professional services, Pakistan · 2024

Finance cash flow dashboard for an immigration consultancy in Islamabad

Interactive KPI dashboard designed and built for the leadership team of an immigration consultancy.

26 KPIs in one view

Sales pipeline dashboard for a fitness studio in Riyadh Dashboards

Health & fitness, Saudi Arabia · 2025

Sales pipeline dashboard for a fitness studio in Riyadh

Interactive KPI dashboard designed and built for the leadership team of a fitness studio.

Report load time down 69%

FAQ

Dashboards questions, answered

Still have a question? Our team replies within one business day.

Looker Studio is free and great for marketing data, Power BI is powerful and affordable for business reporting, and Tableau suits advanced analysis. Custom web dashboards suit client-facing products.

Yes. We audit metrics, data sources, performance and design, then rebuild or optimise what is not working.

Yes. We set up scheduled refreshes or live connections so your numbers are always current.

Yes. We can build secure, branded client dashboards with access controls in Looker Studio, Power BI or a custom web app.

Yes. We offer monthly insight reports that interpret the data and recommend actions.

From the blog

Related reading

Guides from our team that go deeper on this topic.

Related services

Services that pair well with this one for faster results.

Service illustration photo

Business Intelligence Services

Power BI, Tableau and Looker Studio with a solid data model behind them.

Service illustration photo

Data Science Services

Analysis, experimentation and insight from your business data.

Service illustration photo

Business Process Automation

Zapier, Make, n8n and AI workflows that remove manual work.